Course Completion Rates Falling? Start With UX
Author
Vignesh
Published On

Across EdTech platforms, SaaS learning tools, and corporate LMS systems, a silent crisis is growing: course completion rates are steadily declining. While acquisition numbers may look healthy, engagement metrics tell a different story learners are dropping off midway, engagement is inconsistent, and only a small percentage actually complete courses.
Founders often assume this is a content problem or a learner motivation issue. But in reality, the root cause is often far more structural: UX breakdowns in the learning experience. When learners struggle with navigation, lack clarity in progress, face cognitive overload, or encounter friction in the learning journey, they disengage.
Improving course completion is not just a content challenge it is a UX and product design challenge. This is where a focused UX audit for LMS platforms becomes a powerful growth lever.
Why Course Completion Rates Are Falling Across Online Learning Platforms
Online learning has scaled faster than the experiences built to support it. Platforms added more courses, more content formats, and more integrations but the underlying learner journey rarely got redesigned to match.
The result is a widening gap between how much content platforms deliver and how much of it learners actually finish. Founders see it in the metrics: strong sign-up numbers, healthy first-session engagement, and then a steep, familiar drop-off somewhere around module two or three.
The 5 Real Causes of Low Course Completion Rates
1. Cognitive overload from day one
Learners are handed dashboards, syllabi, and navigation menus before they've completed a single lesson. The mental effort of "figuring out the product" competes directly with the mental effort of learning.
2. Invisible progress
When learners can't see how far they've come or how much is left, motivation erodes quickly. Progress that isn't visible might as well not exist.
3. Weak onboarding
Most LMS onboarding explains features. It rarely orients learners toward their first meaningful win. Without an early sense of momentum, drop-off starts in the first session.
4. Friction in navigation and flow
Every extra click, unclear label, or confusing menu adds a small tax on attention. Multiplied across a multi-week course, that tax becomes exhaustion.
5. No feedback loop
Learners who submit an assignment or finish a module and hear nothing back lose the sense that anyone or anything is tracking their progress.
How Poor UX Impacts Course Completion Rates
UX isn't a layer of polish sitting on top of your course content it's the mechanism that determines whether learners ever reach that content in a meaningful way.
Poor UX shows up as friction: confusing navigation, unclear next steps, inconsistent design patterns between modules, and interfaces that require too much interpretation. Every one of these frictions adds a small cost to the learner's cognitive budget. Learners have a limited amount of mental energy to spend in a session, and if UX consumes a large share of it, less is left for actual learning.
This is why two platforms with identical content quality can produce dramatically different completion numbers. The variable isn't the curriculum. It's whether the interface gets out of the learner's way or constantly interrupts them.
Understanding the Learner Journey
A learner's path through an LMS typically moves through five stages: discovery, onboarding, active learning, assessment, and completion. Most platforms design carefully for discovery the marketing site, the enrollment flow and then hand learners off to a generic, undifferentiated experience for everything after.
That's a mistake. Each stage has different emotional and cognitive needs:
Onboarding needs orientation and an early win.
Active learning needs momentum and minimal friction.
Assessment needs clarity and low anxiety.
Completion needs recognition and a clear next step.
Mapping the learner journey stage by stage rather than treating the LMS as one flat experience is one of the fastest ways to spot exactly where drop-off is happening and why.
The Business Impact of Low Course Completion Rates
For founders, low completion rates aren't just a product metric they're a business risk.
Low completion undermines retention and renewal, especially in subscription-based EdTech and corporate LMS models where continued value is tied to learners actually finishing what they start. It weakens word-of-mouth and referral growth, since learners who don't finish rarely become advocates. It also erodes investor and stakeholder confidence, because completion rate is one of the clearest proxies for whether a learning product actually works.
Perhaps most importantly, low completion rates quietly inflate customer acquisition costs. Every learner who churns mid-course is a sale that has to be replaced, rather than expanded through upsells, renewals, or referrals.
Why UX Is the Fastest Lever to Improve Course Completion
Content changes take months: new curriculum, new video production, new instructional design. UX changes can often be shipped in weeks and start moving the needle almost immediately, because they remove friction that's actively working against learners right now.
A UX audit for LMS platforms typically uncovers several "quick win" fixes clarifying a progress indicator, simplifying a navigation pattern, restructuring an onboarding flow that don't require touching a single piece of course content but measurably lift completion within one or two release cycles.
This is why UX audits sit at the center of any serious course completion optimization strategy: they're the fastest, lowest-risk lever available to founders who need results without a full content rebuild.
A UX Audit Framework for Improving Course Completion
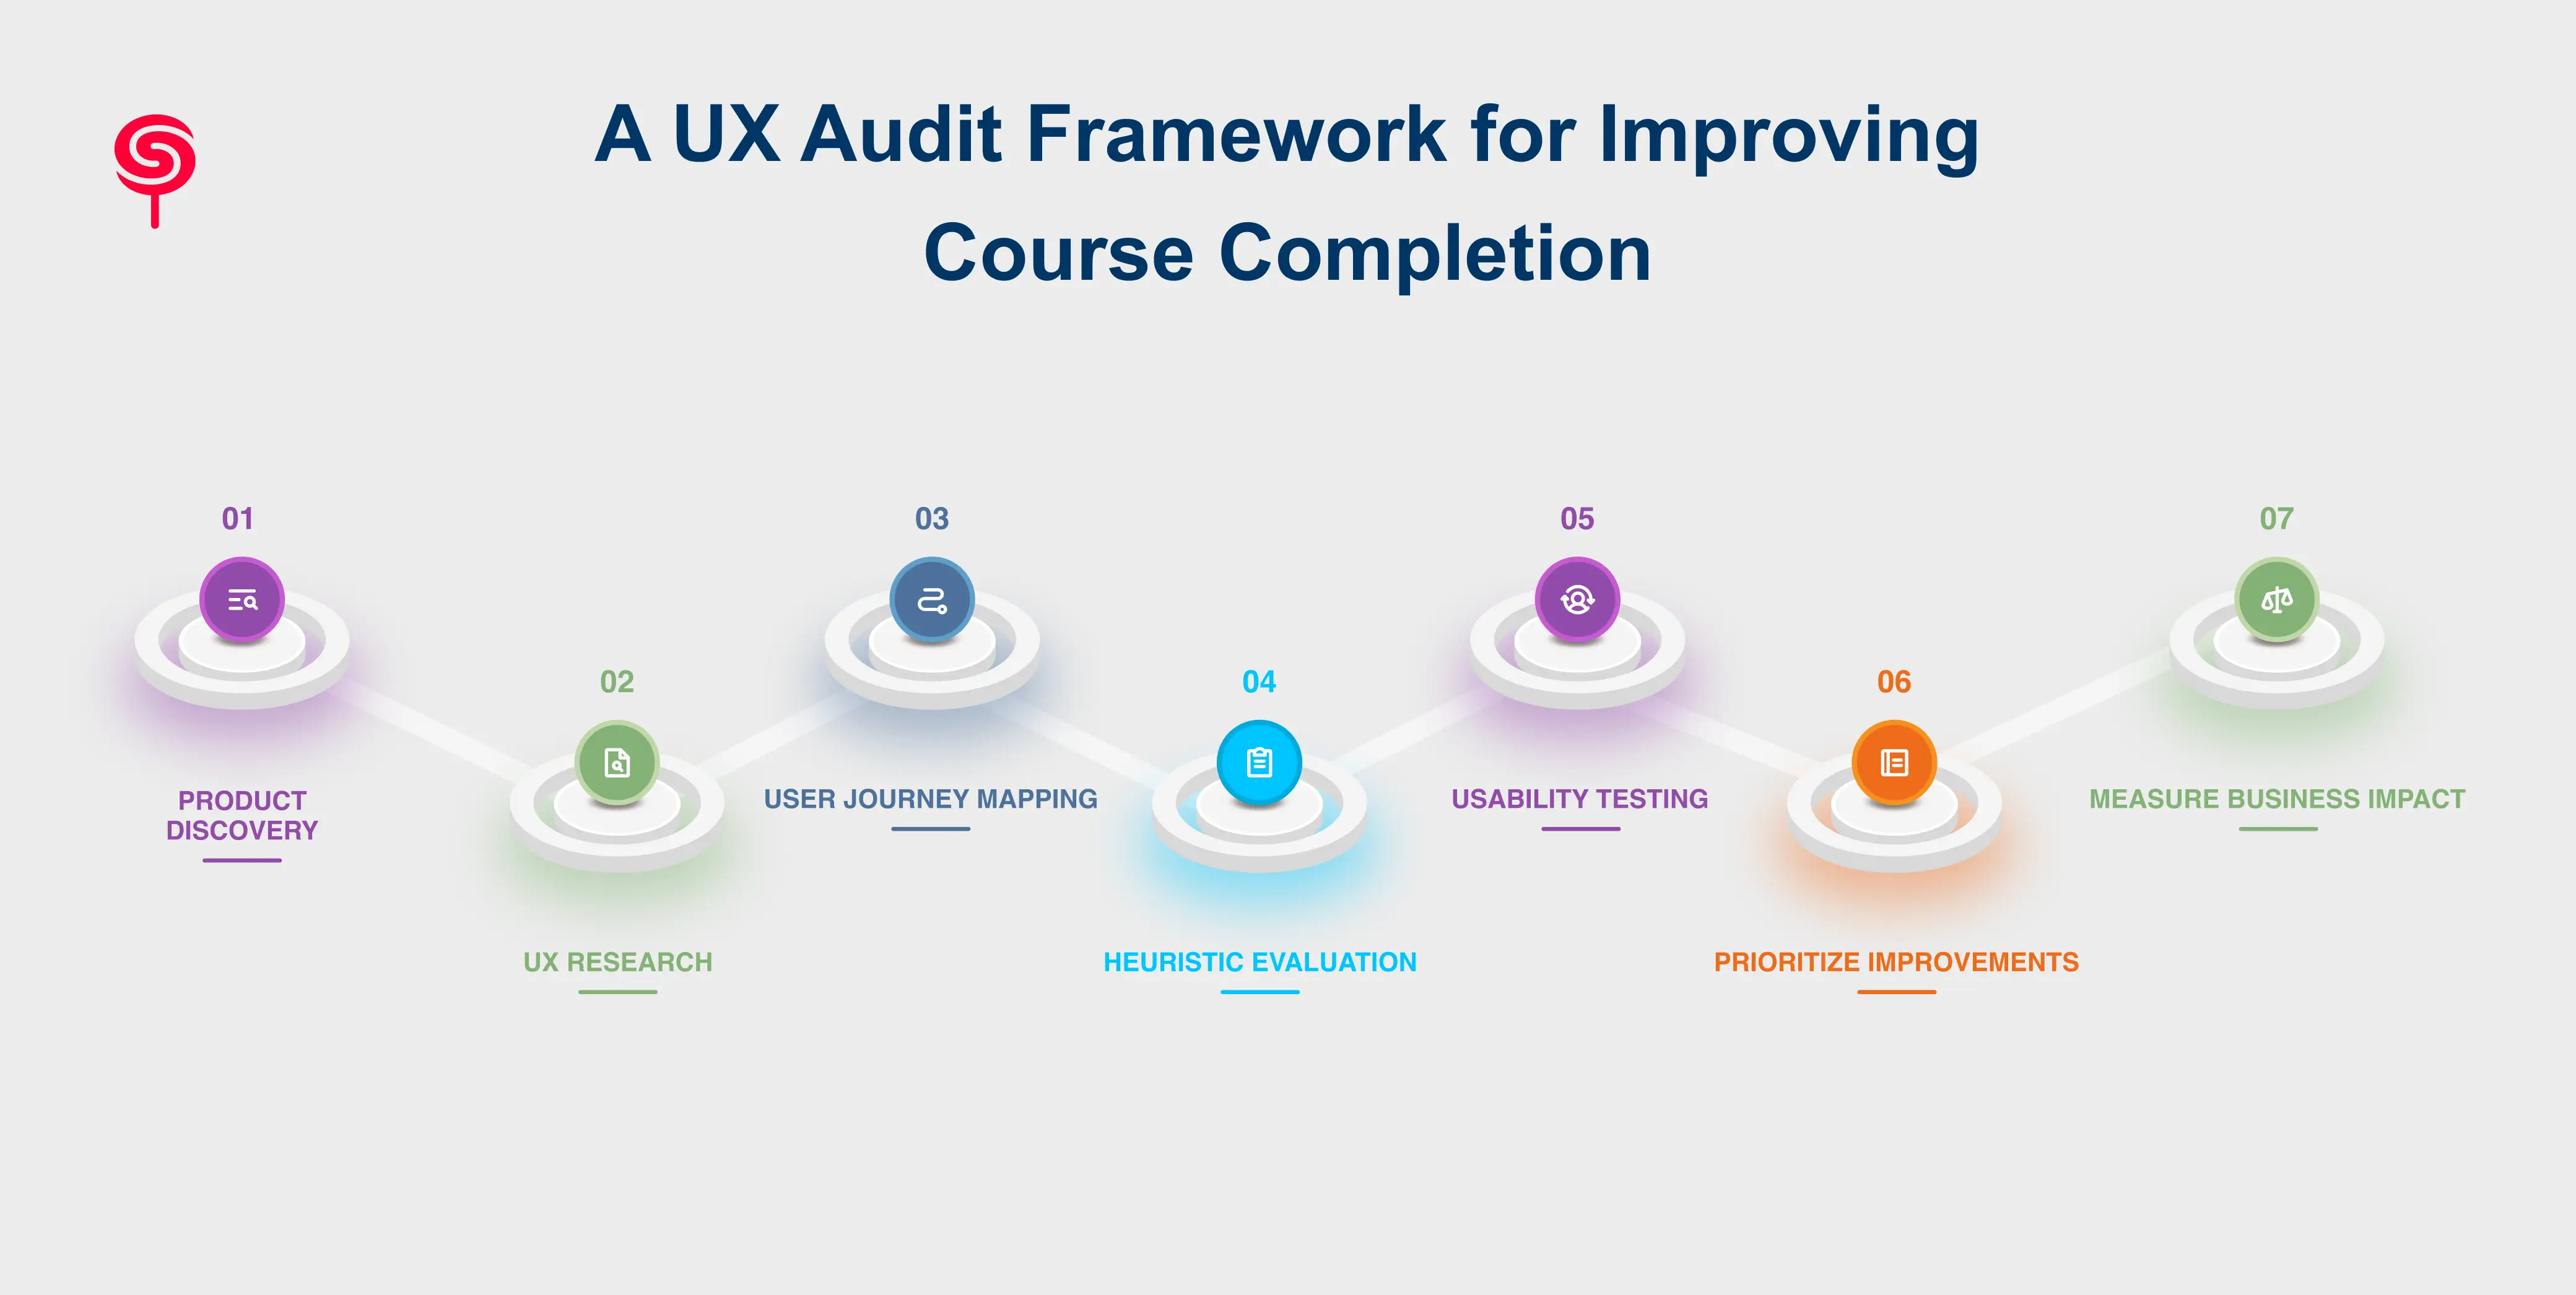
A proper UX audit for learning management systems follows a structured, repeatable process. This is the framework CandyStudio applies with EdTech and LMS clients.
Step 1: Product Discovery
Understand the business goals, target learners, and current completion benchmarks before touching the interface. This grounds every later recommendation in real business context, not aesthetic preference.
Step 2: UX Research
Gather qualitative and quantitative signals learner interviews, support tickets, session recordings, and completion funnel data to identify where and why learners disengage.
Step 3: User Journey Mapping
Chart the learner's path from enrollment through completion, flagging emotional highs and lows, decision points, and moments of friction at each stage.
Step 4: Heuristic Evaluation
Evaluate the interface against established usability principles: clarity, consistency, feedback, and error prevention. This surfaces structural UX problems in learning platforms that data alone won't reveal.
Step 5: Usability Testing
Put real learners in front of the product and observe them completing actual tasks. Usability testing for LMS platforms consistently exposes friction points that internal teams have stopped noticing.
Step 6: Prioritize Improvements
Rank findings by impact versus effort, separating quick UX wins from larger structural redesigns, so founders can sequence work without disrupting the product roadmap.
Step 7: Measure Business Impact
Track completion rate, time-to-first-win, drop-off points, and retention after each change ships, tying every UX improvement back to a measurable business outcome.
UX Design Strategies That Increase Learner Engagement
Several UX patterns consistently move completion rates in the right direction:
Progressive disclosure showing learners only what they need at each step, rather than the entire course structure at once.
Micro-goals breaking long courses into small, clearly labeled milestones that create a steady sense of progress.
Consistent visual language using the same layout, iconography, and interaction patterns across every module so learners spend zero effort re-learning the interface.
Frictionless resumption letting learners pick up exactly where they left off, on any device, without hunting for their place.
Clear feedback confirming submissions, scores, and milestones immediately, so learners always know where they stand.
These strategies form the backbone of modern learning experience design, and each one directly targets a specific cause of drop-off identified earlier.
How Gamification Encourages Learners to Finish Courses
Gamification, used well, taps into the same psychological levers that make progress visible and rewarding: streaks, badges, completion percentages, and light competitive elements like leaderboards.
The key distinction is that effective gamification supports the learning journey rather than distracting from it. Badges and streaks should reinforce genuine progress completing a module, mastering a skill not just reward clicks. When gamification is layered onto a UX that already has strong navigation and clear feedback, it becomes a genuine retention multiplier rather than a superficial add-on.
Measuring UX Success Beyond Course Completion Rates
Completion rate is the headline metric, but it isn't the only signal worth tracking. A mature UX measurement approach also looks at:
Time-to-first-win (how quickly a new learner reaches their first meaningful milestone)
Module-level drop-off (which specific point in the course loses the most learners)
Return frequency (how often learners come back within a course cycle)
Net Promoter Score among completers versus non-completers
Together, these metrics build a fuller picture of learner experience, and they help teams catch emerging UX problems before they show up as a completion rate decline.
How Startup Founders Can Identify UX Problems Early
Founders don't need a full audit to start spotting UX problems. A few early warning signs are worth watching for directly in the data and in the product itself:
A steep drop-off concentrated at one specific module or step
Support tickets clustering around "how do I..." questions
Low re-engagement after the first session
Learners completing lessons but never returning to finish assessments
Any one of these patterns is a strong signal that the issue sits in the experience layer, not the curriculum and an early sign that a structured UX audit will surface more before the problem compounds.
Why CandyStudio
CandyStudio specializes in UX audits for LMS and EdTech platforms, working directly with founders, product managers, and learning experience teams to diagnose exactly why completion rates are falling and to design the fix.
Our process combines UX research, heuristic evaluation, and usability testing with a clear-eyed view of business outcomes, so every recommendation is tied to a measurable result: higher completion, stronger retention, and a learning product that actually delivers on its promise.
Conclusion
Falling course completion rates feel like a content problem, but they're almost always a UX problem in disguise. The learners abandoning your platform aren't rejecting what you're teaching they're getting worn down by how hard it is to keep learning inside your product.
A structured UX audit is the fastest, most reliable way to find out exactly where that friction lives and fix it often within weeks, not months. If completion rates have been sliding and content updates haven't moved the needle, the next step isn't another curriculum revision.
Frequently asked questions
1. Why are course completion rates low on my platform?
Low completion rates are usually driven by UX friction confusing navigation, invisible progress, and weak onboarding rather than weak content.
2. How does a UX audit improve learner engagement?
A UX audit identifies exactly where learners disengage through research, journey mapping, and usability testing, then prioritizes fixes that directly reduce drop-off.
3. What UX changes increase course completion the fastest?
Visible progress indicators, clearer onboarding, consistent navigation, and immediate feedback typically produce the fastest measurable improvements.
4. Why is user experience important for eLearning?
UX determines whether learners can actually reach and engage with content. Even excellent curriculum underperforms if the surrounding experience is difficult to navigate.
5. Can gamification improve course completion rates?
Yes, if designed meaningfully to reinforce progress and learning milestones rather than just adding visual rewards.
Share this blog!
Latest Blogs
Explore our latest insights on design, AI, and digital innovation.