The Design Metrics Every AI Startup Should Track in 2026
Author
Vignesh
Published On

AI startups are building powerful models, but too many founders still struggle to measure whether their product actually works for users. The gap isn’t in model accuracy it’s in UX visibility. Most teams track backend metrics like latency and token usage while missing the human side: did the user get value, trust the output, and come back? In 2026, winning AI SaaS companies treat design metrics as the backbone of product strategy. These are the metrics every AI startup should track to prove adoption, retention, and business impact and to turn engaged readers into UX audit clients who want measurable product experiences.
Why Most AI Startups Struggle to Measure Product Success
Traditional SaaS metrics were built for deterministic software: a user clicks a button, a predictable thing happens. AI products break that model. Outputs are probabilistic, user trust is fragile, and "success" often depends on subjective judgment was the AI's answer actually good?
Most early-stage teams default to metrics borrowed from traditional SaaS playbooks: signups, daily active users, session length, churn. These numbers aren't wrong, but they're incomplete. They tell you that something happened, not whether the AI delivered value or why users abandoned a session. Founders end up optimizing for vanity engagement while real product friction confusing prompts, low-confidence outputs, broken trust after a bad AI response goes completely unmeasured.
The result is a familiar pattern: strong top-of-funnel growth, exciting demo traction, and then a retention curve that quietly collapses by week four because no one was tracking the metrics that actually predict long-term product-market fit for AI experiences.
The Real Problem: AI Startups Are Measuring Features Instead of User Outcomes
Here's the root issue. Most teams track feature usage how many times a button was clicked, how many AI requests were sent instead of user outcomes: did the person accomplish what they came to do, did they trust the result, did they come back.
Feature-centric measurement creates a dangerous illusion of progress. A spike in "AI messages sent" can mean genuine engagement, or it can mean users are retrying a failed prompt five times before giving up. Without outcome-based metrics, both scenarios look identical on a dashboard and only one of them is a product that's working.
This is the gap CandyStudio repeatedly finds during UX audits: the analytics stack is technically sophisticated, but it answers the wrong questions. Fixing this isn't about adding more tracking events. It's about choosing metrics that map directly to user value and business outcomes.
What Are AI Design Metrics and Why Do They Matter?
AI design metrics are measurements that capture how effectively an AI product helps users complete real tasks, builds trust over repeated use, and creates enough value that people choose to return. They sit at the intersection of UX research, product analytics, and AI performance combining traditional usability signals with AI-specific behaviors like prompt clarity, error recovery, and human-AI collaboration quality.
They matter because AI products are judged on a different axis than traditional software. A scheduling app succeeds by being predictable. An AI product succeeds by being useful and trustworthy under uncertainty. Design metrics are how you quantify that trust and without them, growth, retention, and fundraising decisions are all being made on incomplete information.
The Design Metrics Every AI Startup Should Track in 2026
AI Activation Rate
Activation rate measures the percentage of new users who reach a meaningful first outcome with your AI feature not just signed up, but actually experienced the value proposition. For AI products, activation should be tied to a real completed task, such as receiving and accepting a usable AI-generated output, not simply opening the AI panel.
Time to First Value (TTFV)
TTFV tracks how long it takes a new user to get a genuinely useful result from the AI. Long TTFV is one of the strongest predictors of AI product abandonment, because every extra minute of confusion erodes the trust the product needs to earn. Best-in-class AI SaaS products aim for value delivery within the first session, ideally within minutes.
AI Task Completion Rate
Task completion measures whether users who start an AI-assisted workflow actually finish it successfully. This is the clearest outcome-based metric on this list it directly answers "did the AI help, or did the user give up." Segmenting this by task type quickly reveals where your AI underperforms.
Prompt Success Rate
Prompt success rate tracks what percentage of user prompts result in an output the user accepts, uses, or builds on without rewriting, regenerating, or abandoning. A low prompt success rate usually points to UX issues (unclear input guidance) rather than pure model quality, which is why this is a design metric, not just an ML metric.
AI Error Recovery Rate
No AI system is error-free. What separates trusted AI products from abandoned ones is how gracefully they recover. This metric tracks the percentage of failed or low-confidence AI interactions where the user successfully recovers and continues the session, rather than churning out in frustration.
Human-AI Collaboration Efficiency
This measures how much effort a user spends correcting, guiding, or supervising the AI to reach a usable outcome. High-friction collaboration constant edits, re-prompts, manual fixes signals that the AI is creating work instead of removing it, even if raw usage numbers look healthy.
AI Retention Rate
Retention here goes beyond standard cohort retention to ask a sharper question: do users keep choosing the AI feature specifically, over time, instead of reverting to manual workflows? Declining AI-specific retention, even with stable overall retention, often signals eroding trust in the AI's output quality.
Product Usability Score
A composite usability score built from System Usability Scale (SUS) surveys, in-product feedback, and qualitative research gives teams a human-validated check against the behavioral metrics above. Behavioral data shows what users do; usability scores explain why.
How Leading AI Startups Use Design Metrics to Drive Growth
Mature AI product teams treat these metrics as a closed-loop growth system, not a quarterly report. They segment activation and task completion by user type to prioritize roadmap decisions, use prompt success rate to guide onboarding copy and UI design, and tie AI retention directly to expansion revenue and upsell timing. Design and growth teams operate from the same metrics dashboard, which means UX decisions are evaluated by their business impact, not just qualitative feedback. This alignment is often the single biggest difference between AI startups that scale past seed stage and those that stall.
Common Mistakes AI Startups Make When Tracking Metrics
The most frequent mistake is treating AI usage volume as a proxy for value, when high volume can just as easily indicate confusion or repeated failed attempts. A close second is ignoring qualitative signals entirely teams build elaborate event tracking but never run usability sessions, so they can quantify what is happening without ever understanding why. Many teams also fail to segment metrics by task or user intent, which hides exactly where the AI underperforms. Finally, plenty of startups track metrics that look good on an investor deck total AI interactions, sign-ups while ignoring the retention and trust metrics that actually predict whether the business survives the next eighteen months.
A Practical AI Design Metrics Framework for Startup Teams
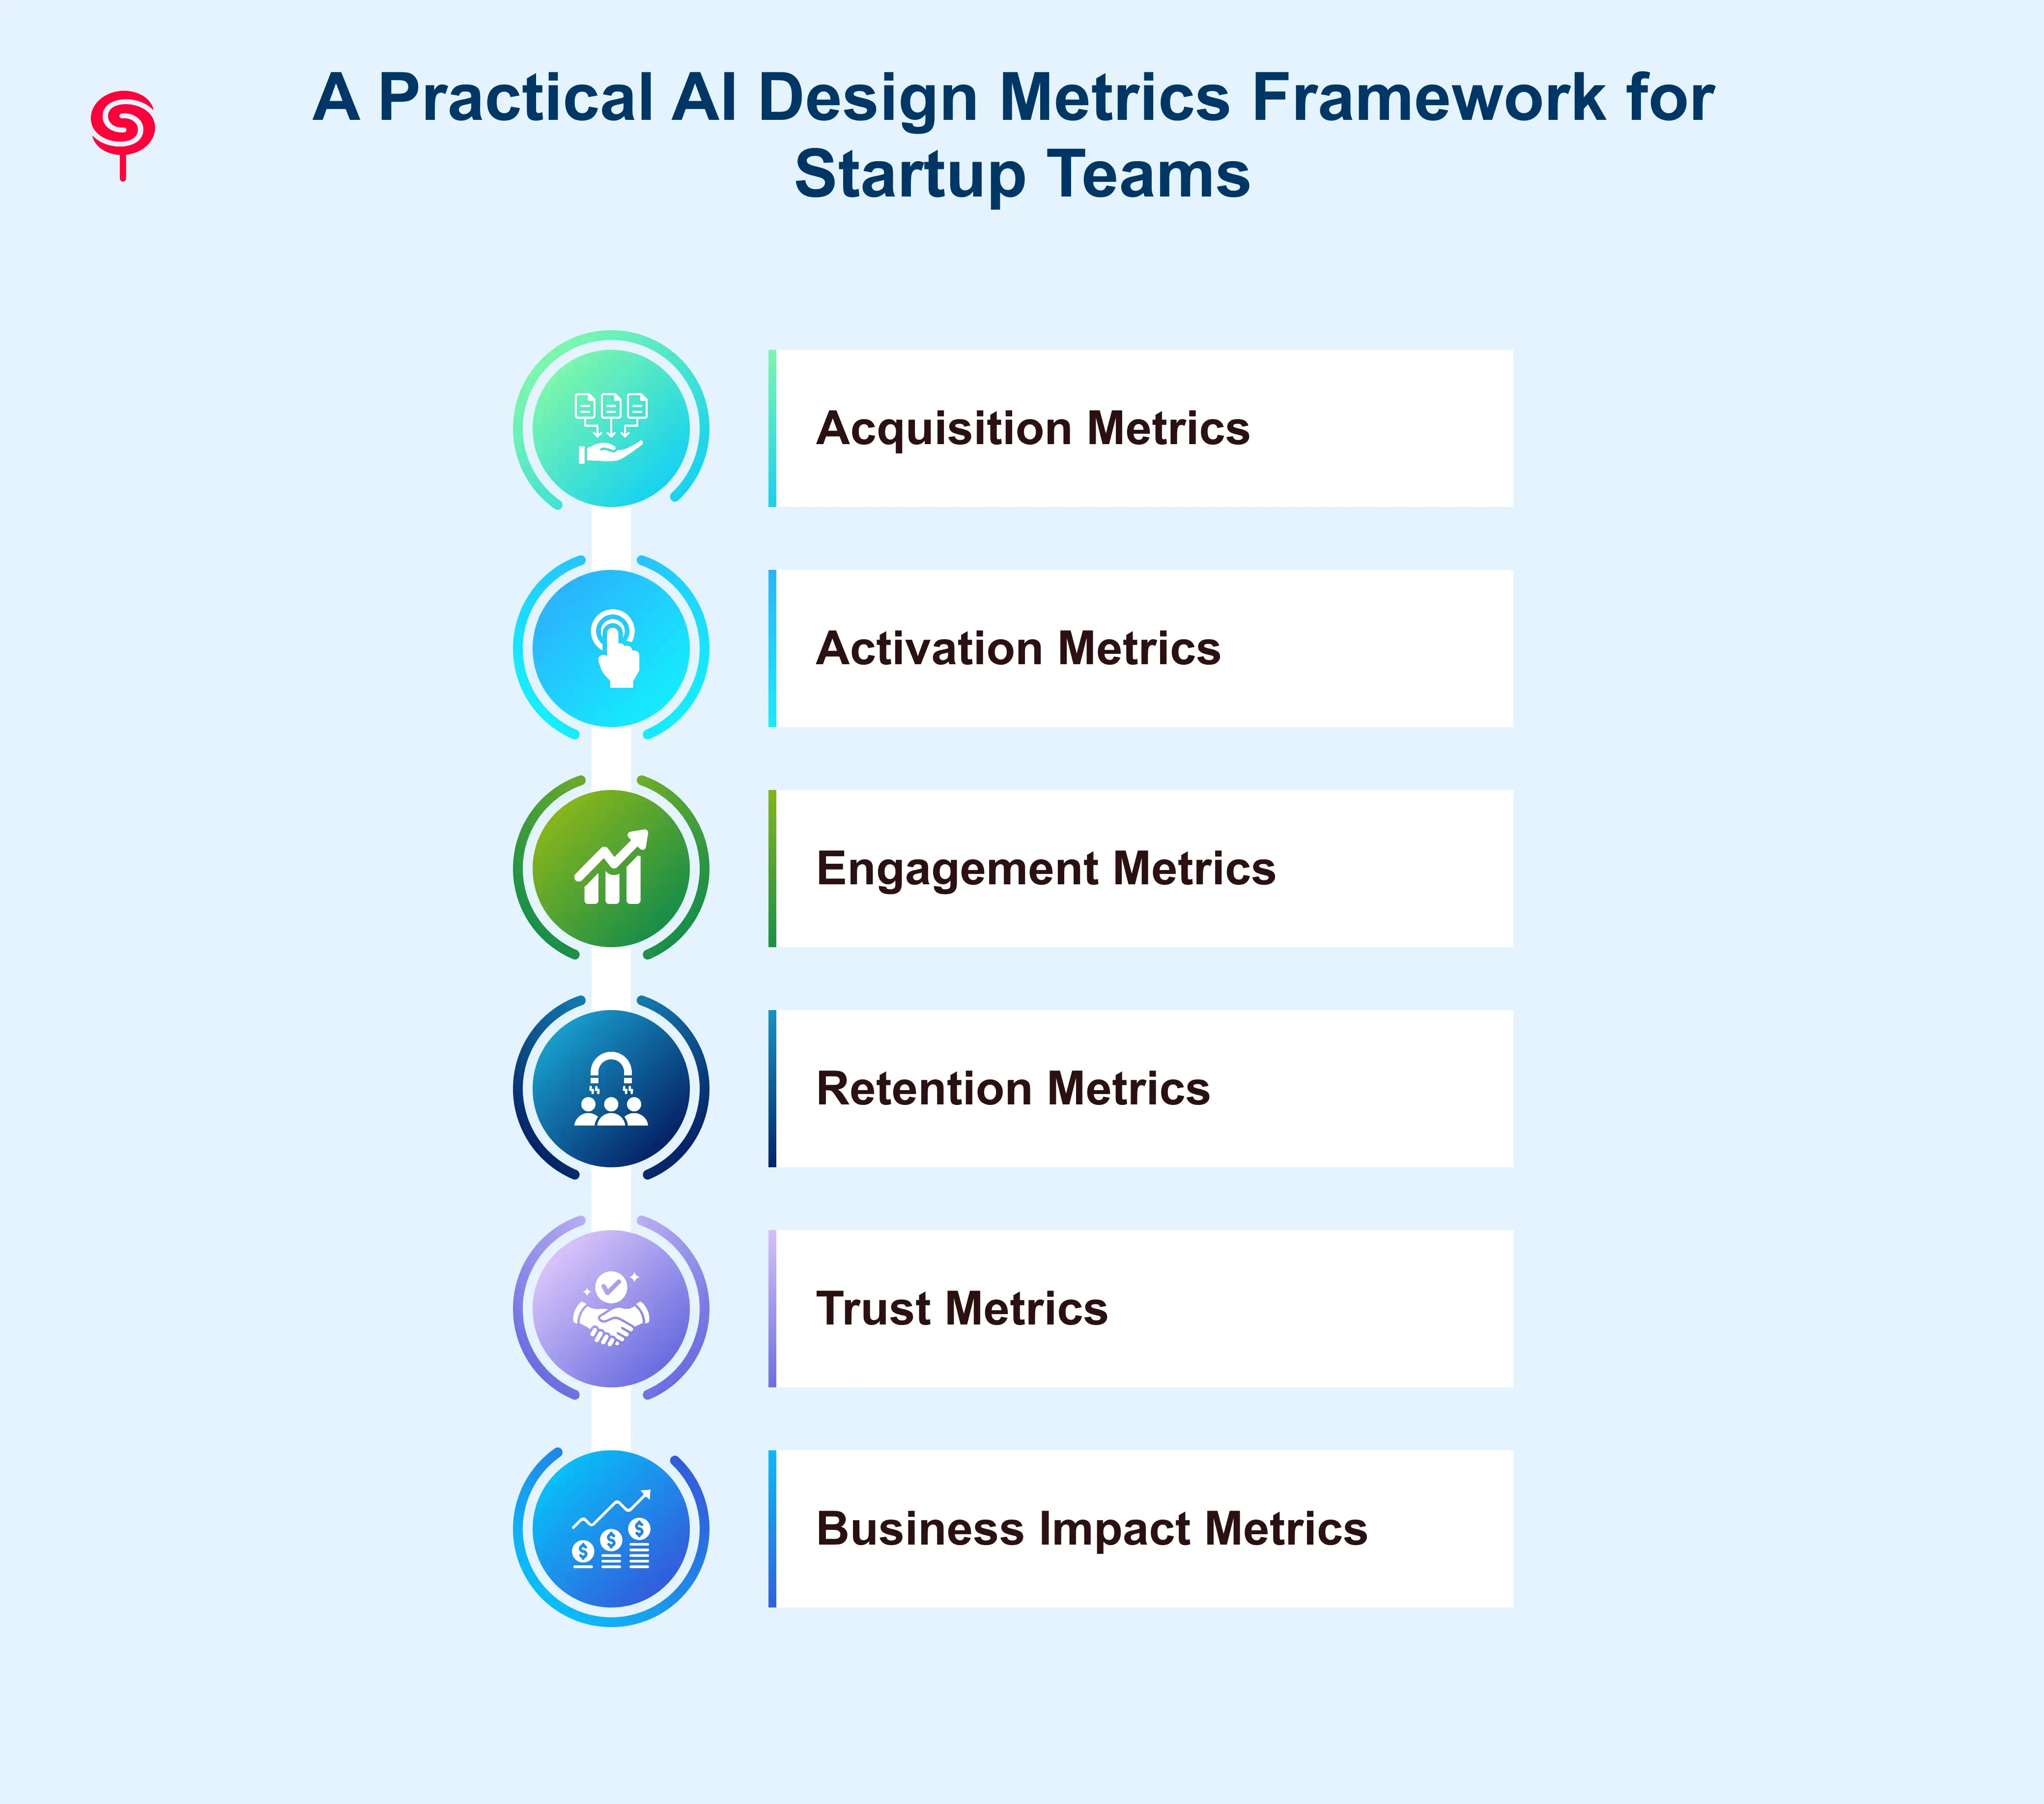
CandyStudio organizes AI product metrics into six layers that map to the full customer lifecycle, so every team design, product, and growth is reading from the same source of truth.
Acquisition Metrics
Traffic quality, signup conversion rate, and cost per qualified signup, segmented by channel so spend can be matched to users most likely to activate.
Activation Metrics
AI activation rate and Time to First Value, the earliest predictors of whether a user will ever become a long-term customer.
Engagement Metrics
AI feature adoption rate, task completion rate, and prompt success rate the metrics that reveal whether the AI is genuinely doing the job it was built for.
Retention Metrics
AI-specific retention and cohort analysis by use case, isolating whether churn is a product-wide issue or specific to the AI experience.
Trust Metrics
Error recovery rate and human-AI collaboration efficiency, which quantify the often-invisible cost of working with an imperfect AI system.
Business Impact Metrics
Expansion revenue, NPS, and customer lifetime value tied back to AI engagement levels, connecting design decisions directly to revenue outcomes.
How Better Design Metrics Improve Business Outcomes
When startups adopt this kind of framework, the impact shows up across the business, not just in the product. Shorter TTFV reduces onboarding drop-off and improves paid conversion. Higher prompt success and task completion rates reduce support burden and increase organic word-of-mouth. Stronger AI-specific retention compounds into higher lifetime value and a more defensible moat because trust, once earned, is hard for competitors to replicate. Most importantly, founders gain the clarity to make confident roadmap and fundraising decisions, backed by evidence instead of intuition.
How CandyStudio Helps AI Startups Build Measurable Product Experiences
CandyStudio works with AI SaaS founders and product teams to close the gap between "shipping AI features" and "building a measurable, trusted AI product." Our UX audits map your product against the metrics framework above, identify exactly where activation, trust, or task completion is breaking down, and deliver a prioritized design roadmap tied to business outcomes not just visual polish.
If your AI product has strong top-line traction but you can't confidently explain your activation, retention, or trust metrics, that's usually the clearest sign it's time for a structured UX and product audit. This is the work CandyStudio specializes in: helping AI startups turn ambiguous usage data into a clear, defensible growth strategy.
Conclusion
AI products succeed or fail on trust, clarity, and outcomes not feature counts. The startups that win in 2026 will be the ones that move past vanity metrics and build measurement systems around activation, task completion, prompt success, error recovery, and AI-specific retention. Get the metrics right, and design stops being a cost center and becomes a measurable growth lever. If you're ready to find out exactly where your AI product's metrics are breaking down, CandyStudio's UX audit is built to answer that question.
Frequently Asked Questions
1. How do you measure AI product success?
AI product success is measured through activation rates, Time to First Value, adoption rates, task completion rates, retention, trust metrics, and business impact indicators.
2. What are the most important AI UX metrics for startups in 2026?
The highest-priority metrics are AI activation rate, Time to First Value, task completion rate, and AI-specific retention, since they most directly predict whether users find the AI genuinely valuable enough to keep using.
3. How can CandyStudio help us improve our AI product metrics?
CandyStudio runs structured UX audits that map your current metrics against this framework, pinpoint where activation, trust, or retention is breaking down, and deliver a prioritized design roadmap to fix it.
4. What is a good AI feature adoption rate?
There's no universal benchmark, since it varies by product category, but a meaningful warning sign is when AI feature adoption is significantly lower than overall product engagement it usually means the AI isn't solving a problem users actually have.
Share this blog!
Latest Blogs
Explore our latest insights on design, AI, and digital innovation.


